Your network is the backbone of everything your business does digitally. When it goes down, your applications fail, your users get frustrated, and your revenue takes a hit. But here's the thing - most network outages don't happen suddenly. They start with subtle performance degradation that goes unnoticed until it's too late.
That's where network monitoring comes in. The right tool can spot problems before they become outages, help you optimize performance, and give you the visibility you need to make informed infrastructure decisions. But with dozens of monitoring solutions on the market, how do you pick the right one?
After working with companies across Idaho's Treasure Valley - from healthcare startups in Boise to manufacturing companies in Nampa - I've seen what works and what doesn't. Let me walk you through the eight critical features that separate good monitoring tools from great ones.
Real-Time Performance Metrics That Actually Matter
The foundation of any solid network monitoring tool is real-time data collection. But not all metrics are created equal. You don't need a dashboard that shows you 50 different graphs - you need the right data presented clearly.
Essential performance metrics include:
- Latency measurements - Round-trip times, jitter, and packet loss
- Bandwidth utilization - Current usage vs. capacity across all links
- Device health - CPU, memory, and temperature for network hardware
- Application response times - End-to-end performance from the user's perspective
Here's what I've learned: tools that flood you with data aren't necessarily better. A CTO at a Meridian-based software company told me their previous monitoring solution generated so many alerts that they started ignoring them. "We had alert fatigue," he said. "When the real outage happened, we missed it in the noise."
Look for tools that let you customize thresholds and create intelligent alerting rules. The best solutions use baseline learning to understand what's normal for your network and only alert when something genuinely unusual happens.
Comprehensive Network Discovery and Mapping
Your monitoring tool should automatically discover and map your entire network topology. This isn't just about convenience - it's about security and accuracy. Manual network documentation gets outdated fast, especially in dynamic environments with containers and cloud resources.
Modern discovery features should handle:
# Example: Automated discovery protocols
SNMP v2c/v3 for managed devices
CDP/LLDP for network topology
WMI for Windows environments
SSH/API calls for cloud resources
The tool should create visual network maps that update automatically as your infrastructure changes. When you're troubleshooting at 2 AM, a clear network diagram can save hours of detective work.
I worked with a healthcare company that discovered they had 30% more network devices than they thought they did. Their old monitoring tool only tracked manually configured devices, missing shadow IT deployments and forgotten test equipment. That's a security risk waiting to happen.
Advanced Alerting with Context and Intelligence
Basic threshold alerting is table stakes. What you really need is intelligent alerting that understands context and relationships between different network elements.
Smart alerting features to look for:
- Dependency mapping - If a core switch fails, don't alert on every downstream device
- Alert correlation - Group related alerts to show the root cause
- Escalation policies - Route alerts to the right person based on severity and time
- Integration capabilities - Send alerts to Slack, PagerDuty, or your existing workflow tools
The best tools also provide alert context. Instead of just "High CPU on Router-01," you get "High CPU on Router-01 (98% for 5 minutes) coinciding with 400% increase in VPN traffic from remote office."
Multi-Vendor Device Support
Unless you're running a completely homogeneous network (and who is?), your monitoring tool needs to speak multiple vendor languages. This is especially important for companies that have grown through acquisitions or evolved their infrastructure over time.
Your tool should natively support:
- Cisco (IOS, NX-OS, ASA)
- Juniper (JunOS)
- HP/Aruba switches and wireless
- Fortinet security appliances
- VMware virtual networking
- Cloud platforms (AWS VPC, Azure vNet, Google Cloud)
But here's the catch - "support" doesn't just mean the tool can collect basic SNMP data. It should understand vendor-specific features, provide relevant metrics, and offer appropriate configuration templates.
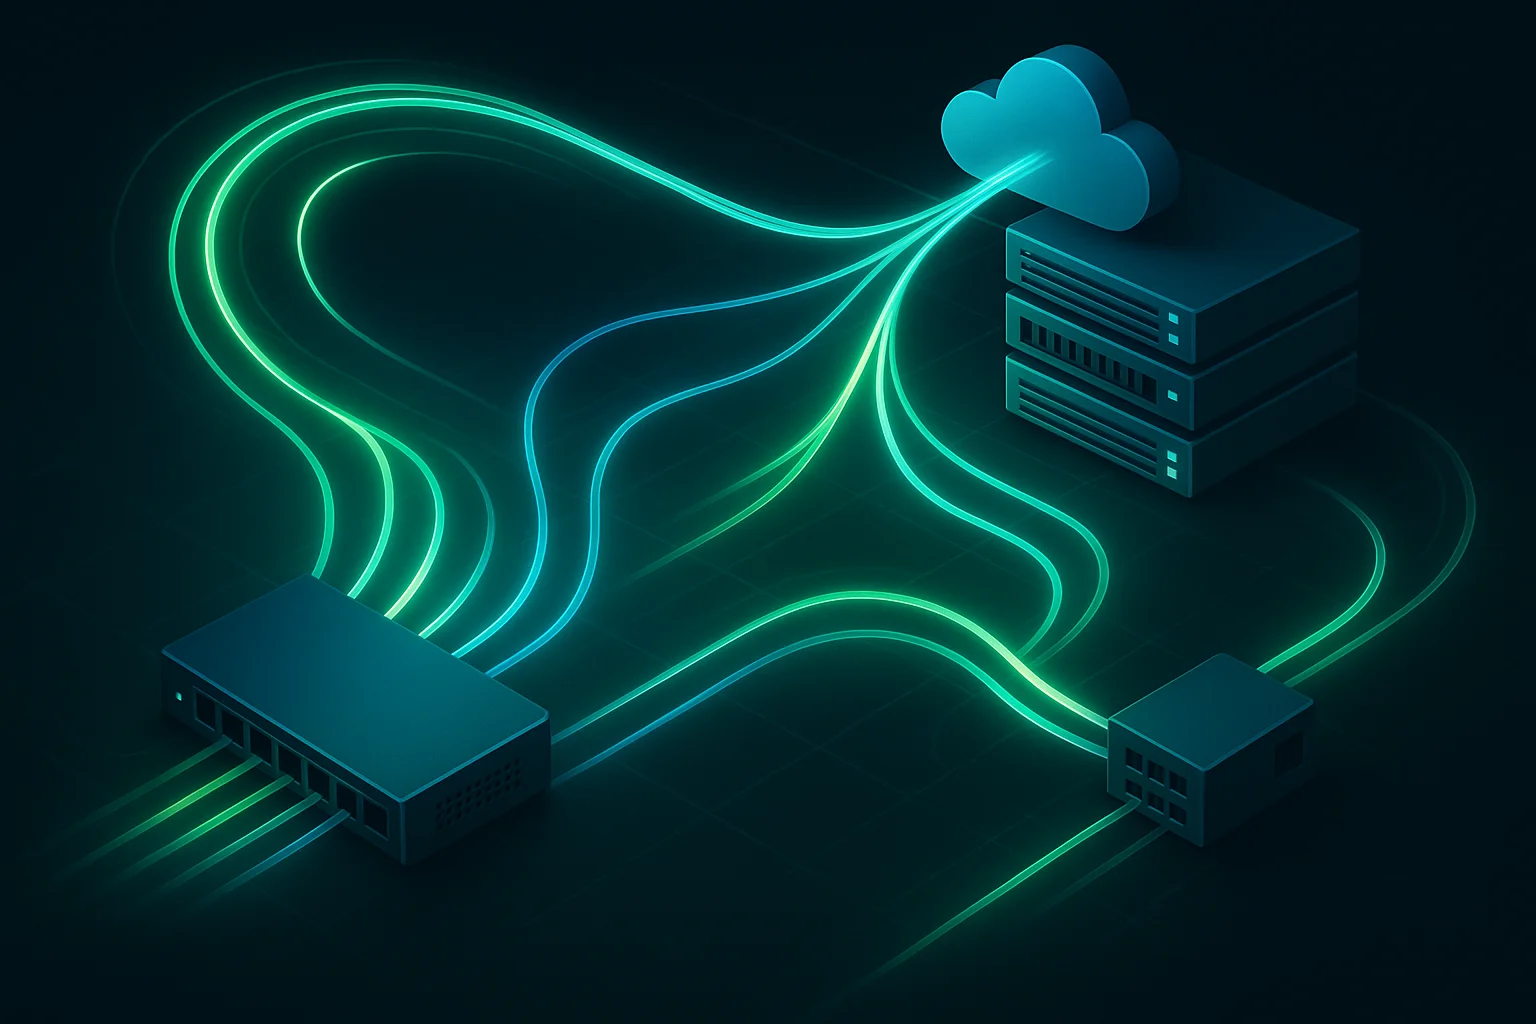
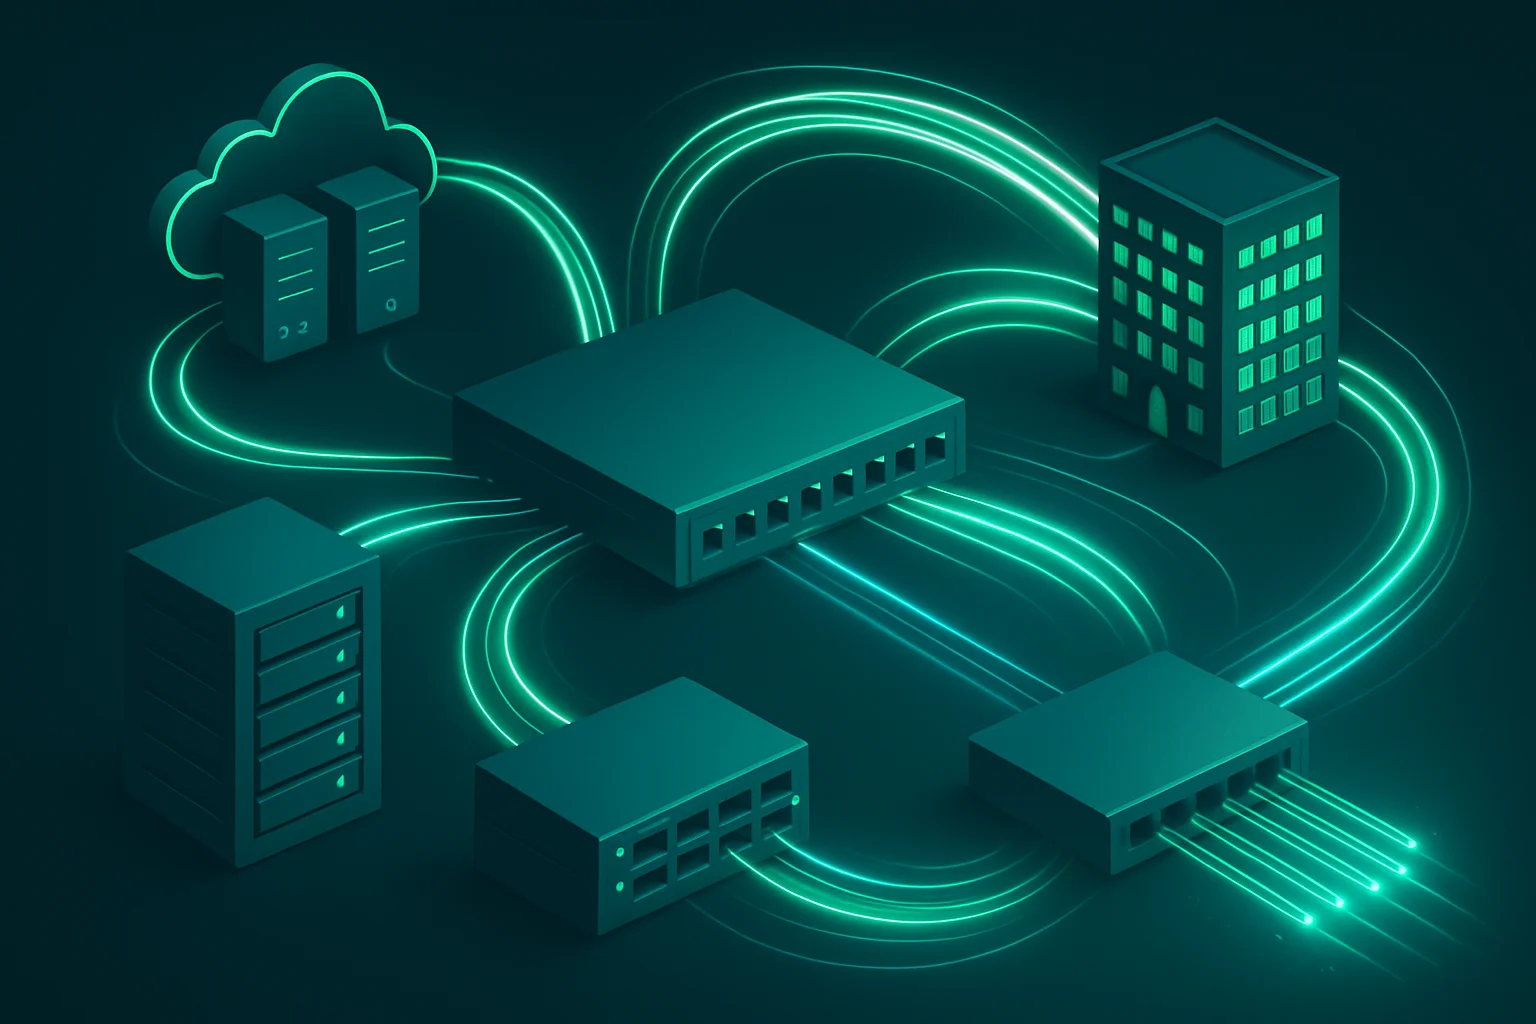
Cloud and Hybrid Infrastructure Monitoring
Your network doesn't stop at your data center edge anymore. Modern monitoring tools must handle hybrid environments seamlessly, whether you're running workloads in AWS, Azure, or right here in Idaho with IDACORE's cloud infrastructure.
Key hybrid monitoring capabilities:
- Multi-cloud visibility - Monitor AWS VPCs, Azure virtual networks, and private cloud simultaneously
- API integration - Pull metrics directly from cloud provider APIs
- Container network monitoring - Track Kubernetes pod-to-pod communication
- SD-WAN support - Monitor software-defined networking across locations
Companies running hybrid setups often struggle with monitoring silos. Your AWS team uses CloudWatch, your on-premise team uses something else, and nobody has a complete picture. The right tool bridges these gaps.
Historical Data and Trend Analysis
Real-time monitoring tells you what's happening now. Historical data tells you why it's happening and what might happen next. This is where you move from reactive firefighting to proactive capacity planning.
Look for tools that provide:
Data Retention:
  Raw metrics: 24-48 hours
  5-minute averages: 30 days
  Hourly averages: 1 year
  Daily averages: 5+ years
Trend analysis features should include:
- Capacity forecasting - Predict when you'll hit bandwidth limits
- Performance baselines - Understand normal vs. abnormal behavior
- Growth planning - Track usage patterns over time
- Compliance reporting - Generate historical reports for audits
I've seen too many companies get caught off-guard by capacity issues. A manufacturing company in Caldwell was experiencing intermittent slowdowns during their busy season. Historical data revealed that their internet connection was hitting 85% utilization during peak hours - not enough to trigger alerts, but enough to impact performance.
Customizable Dashboards and Reporting
Your monitoring tool should adapt to your workflow, not the other way around. Different roles need different views of the same data. Your NOC team needs operational dashboards with current status. Your management team needs executive summaries with trends and SLAs.
Essential dashboard features:
- Role-based views - Different dashboards for different users
- Drag-and-drop customization - Easy to modify without vendor support
- Mobile responsiveness - Check network status from your phone
- Automated reporting - Schedule reports for stakeholders
The best tools also support embedding dashboards in other systems. If your team already lives in Grafana or your company portal, the monitoring data should be available there too.
API Access and Integration Capabilities
Your monitoring tool shouldn't be an island. It needs to integrate with your existing toolchain - ticketing systems, automation platforms, configuration management, and business applications.
Critical integration points:
# Example: API-driven automation
import requests

def check_network_health():
    response = requests.get(
        'https://monitoring-api.yourcompany.com/health',
        headers={'Authorization': 'Bearer your-token'}
    )
    return response.json()

# Trigger automated responses based on network state
if check_network_health()['status'] == 'degraded':
    scale_application_servers()
Modern monitoring tools should offer:
- RESTful APIs for programmatic access
- Webhook support for real-time event streaming
- Pre-built integrations with popular tools (ServiceNow, Jira, Ansible)
- Export capabilities for compliance and analysis
Making the Right Choice for Your Environment
Selecting a monitoring tool isn't just about features - it's about finding the right fit for your specific environment, team, and budget. Here's a practical framework I use when helping companies evaluate options:
Start with your requirements:
- Network size and complexity - How many devices and locations?
- Team expertise - Do you need a simple tool or can you handle complexity?
- Budget constraints - Consider both licensing and operational costs
- Compliance needs - Healthcare and finance have specific requirements
- Growth plans - Will the tool scale with your business?
Evaluate with real data:
Don't just watch vendor demos. Get a trial license and test with your actual network. Set up monitoring for your most critical paths and see how the tool performs under real conditions.
Consider the total cost of ownership:
The tool's license cost is just the beginning. Factor in:
- Implementation and training time
- Ongoing maintenance requirements
- Storage costs for historical data
- Integration development effort
Real-World Implementation: Lessons from the Field
Last year, I helped a Boise-based financial services company replace their aging monitoring infrastructure. They were running three different tools that didn't talk to each other, creating blind spots and operational inefficiency.
We evaluated five different solutions over three months. The winner wasn't the most feature-rich or the cheapest - it was the one that best fit their hybrid environment and provided the clearest path to operational improvement.
Key lessons from their implementation:
- Start small and expand - They monitored critical infrastructure first, then added branch offices
- Train your team early - Invested in proper training before going live
- Plan for data migration - Historical data migration took longer than expected
- Test failover scenarios - Made sure monitoring stayed up during network outages
Six months later, they've reduced their mean time to resolution by 60% and caught three potential outages before they impacted users.
Transform Your Network Visibility with Local Expertise
Choosing the right monitoring tool is just the first step. You also need infrastructure that can support comprehensive monitoring without breaking your budget. That's where Idaho businesses have a unique advantage.
IDACORE's Boise data center provides the perfect foundation for network monitoring infrastructure. With sub-5ms latency to Treasure Valley businesses and 30-40% cost savings compared to hyperscaler alternatives, you get better performance at a fraction of the cost. Our local team understands Idaho business requirements and can help you design monitoring solutions that actually work in the real world.
Start building better network visibility with infrastructure that makes sense for your business and your budget.